
66
Published
July 2026
Updated
July 2026
The Web3 Community Engagement Metrics Crypto Founders Measure

Tyler Mullins
Founder & Owner of OMNI
Introduction
Most crypto founders track Twitter followers and Discord member counts, then wonder why those numbers fail to predict protocol health or token price stability. The disconnect happens because surface-level metrics measure attention, not commitment - and in Web3, the gap between those two states determines whether you're building a sustainable moat or funding an expensive list of airdrop mercenaries.
That attention-without-commitment pattern compounds fast. Projects that optimize for vanity metrics discover too late that 80% of their "community" disappears the moment rewards dry up, leaving cap tables full of investors asking why marketing spend didn't translate to protocol usage. By the time most teams recognize the problem, they've burned six months and $200K+ chasing metrics that don't correlate with the outcomes VCs actually fund: retention, transaction volume, and governance participation.
The answer isn't measuring more - it's measuring what matters. What follows is the complete framework crypto founders use to separate economic signals from noise: the metrics that predict protocol longevity, the tools that bridge off-chain engagement with on-chain behavior, and the benchmarks that define "good" across DeFi, DePIN, and infrastructure verticals.
Key Takeaways
The total crypto market cap crossed the $4 trillion threshold for the first time in 2025, intensifying competition for user attention and making quality community metrics essential for project survival.
Founders must distinguish between economic metrics like Transaction Value Enabled and vanity metrics like follower counts, as only the former correlates with fundraising success and token price stability.
On-chain wallet behavior - tracked through retention cohorts and governance participation - predicts long-term project health better than off-chain social signals alone.
Web3 builder interest increased 78% on Solana between 2023 and 2025, demonstrating how developer activity serves as a leading indicator of ecosystem strength.
Filtering airdrop hunters from real advocates requires multi-layered attribution systems that link social IDs to wallet addresses and measure post-incentive retention rates.
Table of Contents
Why Vanity Metrics Fail in Web3
The Metric Evolution: From Followers to Economic Value
Core On-Chain Engagement Metrics Every Founder Tracks
How to Measure Community-Led Growth (CLG) in DeFi and DePIN
Filtering Airdrop Hunters vs. Real Users
What Does OG Stand for in Web3 Community Crypto?
The Founder's Dashboard: 5 Metrics VCs Actually Care About
Tools for On-Chain Community Attribution
Frequently Asked Questions
Why Vanity Metrics Fail in Web3
Vanity metrics - follower counts, total Discord members, aggregate impressions - are structural mismatches for decentralized protocols because they measure awareness in ecosystems that reward action. A project with 50,000 Twitter followers and 15,000 Discord members looks substantial until you examine on-chain data and discover that fewer than 800 unique wallets have interacted with the protocol in the past 30 days, and half of those wallets executed a single transaction before going dormant.
This gap exists because Web3 projects attract three distinct audience segments with radically different engagement patterns:
Segment 1: Airdrop Mercenaries - Users who engage with content, complete quests, and participate in governance exclusively to qualify for token distributions. Research from on-chain analytics platforms shows that 60-75% of airdrop recipients sell their allocation within 48 hours and never return to the protocol.
Segment 2: Speculative Observers - Traders and researchers monitoring projects for entry signals but who have no intention of using the protocol's core functionality. This cohort generates social engagement (likes, retweets, comments) but rarely converts to transaction volume or TVL contribution.
Segment 3: Economic Participants - Users who interact with the protocol because it solves a real problem or offers better unit economics than alternatives. This group represents 5-15% of most communities but accounts for 70-90% of protocol revenue and long-term retention.
Traditional marketing metrics can't distinguish between these segments because they measure actions that cost nothing (following an account, joining a server) rather than actions that reveal commitment (staking capital, paying gas fees, voting in governance). The result is what industry observers call "ghost communities" - projects with impressive surface numbers that collapse the moment incentives shift.
The structural problem compounds when founders report these vanity metrics to investors. A Series A pitch deck showing "300% Discord growth quarter-over-quarter" creates an illusion of momentum that evaporates under due diligence when VCs examine wallet-level data and discover that actual protocol usage remained flat or declined during the same period. This disconnect between reported growth and economic reality has become a pattern recognition trigger for experienced crypto investors, who now demand on-chain validation of every community claim.
The Metric Evolution: From Followers to Economic Value
Economic metrics measure how much value flows through a protocol and how sticky that value becomes over time. These indicators matter because they correlate with the outcomes that determine project survival: fundraising success, token price stability, and ecosystem sustainability.
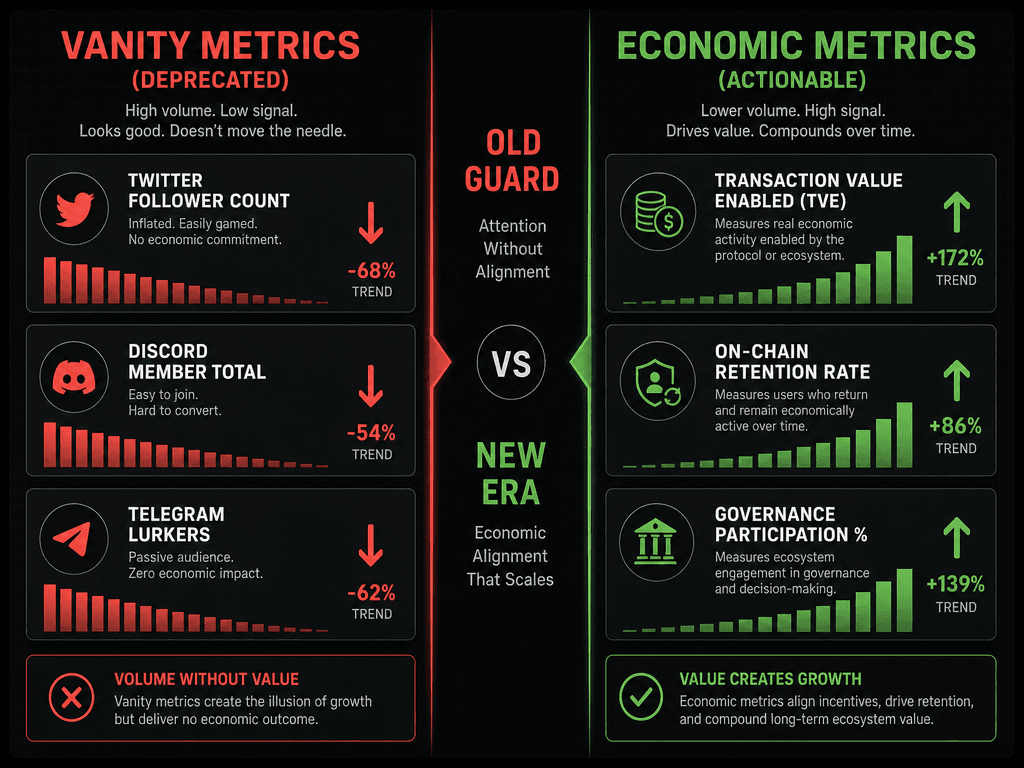
Transitioning from vanity metrics to economic indicators like TVE is critical for founders aiming to build a sustainable, long-term project moat.
The shift from vanity to economic metrics tracks three core dimensions:
Transaction Value Enabled (TVE)
Chainlink pioneered this metric to quantify the economic activity their oracle network secured. By 2022, Chainlink reported over $6 trillion in TVE - a number that communicated protocol utility far more effectively than user counts or social followers. TVE works for any protocol that facilitates transactions: it measures the dollar value of activity your infrastructure makes possible, not just the raw number of transactions processed.
For DeFi protocols, TVE translates to total transaction volume processed. For DePIN projects, it might represent the aggregate value of compute resources sold or storage capacity utilized. The metric's power lies in its direct correlation to protocol revenue - if TVE grows sustainably, fee income grows proportionally.
Active Wallet Retention Cohorts
The total crypto market cap crossed the $4 trillion threshold for the first time in 2025, but that growth masked a retention crisis: most protocols lose 80-90% of new wallets within 30 days. Retention cohort analysis solves this by tracking what percentage of wallets active in Week 1 remain active in Week 4, Week 8, and Week 12.
Sustainable protocols show retention curves that flatten after an initial drop-off - typically retaining 15-25% of initial users past the 90-day mark. Mercenary-driven projects show continuous decline, with retention approaching zero by Month 3. This pattern difference allows founders to diagnose community health before it impacts token price or fundraising conversations.
Retention cohorts also reveal quality of acquisition channels. If organic Discord referrals retain at 28% while paid Twitter campaigns retain at 4%, that signal should reshape budget allocation immediately.
Developer Activity as Leading Indicator
Solana builder interest increased by 78% between 2023 and 2025, a metric that preceded explosive growth in transaction volume and token price appreciation. GitHub commits, active contributors, and third-party integrations predict ecosystem momentum because developers only invest time in protocols with technical credibility and economic viability.
Tracking developer engagement requires monitoring:
Monthly active contributors to core repositories
Third-party projects building on your protocol (measured by new smart contract deployments referencing your infrastructure)
Developer forum engagement depth (measured by discussion thread length and time-to-resolution for technical questions)
The market for tokenized Real-World Assets reached $30 billion in 2025, but the protocols that captured disproportionate market share were those that built developer ecosystems first and marketed to end users second. This inverted funnel - where B2D (business to developer) precedes B2C - has become the default playbook for infrastructure projects.
Founders looking to build comprehensive strategies around these metrics often partner with specialized crypto marketing strategy teams that understand how to bridge on-chain behavior with off-chain growth.
Core On-Chain Engagement Metrics Every Founder Tracks
On-chain metrics are non-negotiable for crypto founders because they measure behavior that costs real resources - gas fees, capital lock-up, opportunity cost - and therefore reveal genuine commitment rather than casual interest.
Daily Active Addresses (DAA) vs. Monthly Active Addresses (MAA)
DAA counts unique wallet addresses that execute at least one transaction in a 24-hour period. MAA extends that window to 30 days. The ratio between these two metrics reveals usage pattern concentration: protocols with DAA/MAA ratios above 0.25 show daily habit formation, while ratios below 0.10 indicate sporadic engagement concentrated around specific events (airdrops, governance votes, token unlocks).
Blockchains now process over 3,400 transactions per second as of 2025, representing 100x growth in five years, but aggregate throughput numbers mask protocol-level variations. A DeFi lending protocol with 5,000 MAA but only 400 DAA faces a different growth challenge than a gaming protocol with identical MAA but 3,000 DAA - the former needs better daily utility hooks, while the latter needs broader awareness.
Gas Spend Per User
Total gas fees paid by users interacting with your protocol measures economic commitment more precisely than transaction counts alone. A user who pays $50 in gas fees across 10 transactions demonstrates higher intent than a user executing 100 transactions at $0.10 each - the former is solving a real problem, while the latter might be farming airdrops or testing functionality.
Tracking median gas spend per user (not just mean) prevents whale behavior from skewing perception. If median gas spend trends upward over time, protocol utility is increasing at the user level. If median spend remains flat while total volume grows, expansion is coming from user count rather than deepening engagement.
Token Holder Distribution and Concentration
Over 13 million memecoins launched in the 12 months preceding September 2025, and most collapsed because token distribution concentrated in fewer than 50 wallets. Sustainable protocols maintain token holder counts that grow proportionally to TVL - if Total Value Locked increases 200% but holder count only rises 30%, value accumulation is concentrating rather than distributing.
The Gini coefficient, borrowed from wealth inequality measurement, quantifies token concentration: protocols with Gini coefficients above 0.85 face heightened manipulation risk and shallow liquidity. Scores between 0.5-0.7 indicate healthier distribution patterns where economic incentives align across diverse stakeholder groups.
Metric | What It Measures | Target Benchmark | Red Flag Threshold |
|---|---|---|---|
Daily Active Addresses (DAA) | Unique wallets transacting daily | 15-25% of MAA | Below 8% of MAA |
Median Gas Spend per User | Economic commitment intensity | $8-$25/month (DeFi), $2-$5/month (Gaming) | Declining month-over-month |
90-Day Retention Rate | Long-term user stickiness | 18-28% for DeFi, 12-20% for NFT projects | Below 10% |
Token Holder Growth Rate | Distribution velocity | 1.2-1.8x TVL growth rate | Below 0.5x TVL growth |
Governance Participation % | Committed stakeholder base | 12-20% of eligible token holders | Below 5% |
Teams struggling to implement these measurement frameworks often work with crypto community management specialists who can operationalize tracking infrastructure and create automated reporting systems.
How to Measure Community-Led Growth (CLG) in DeFi and DePIN
Community-led growth happens when existing users drive new user acquisition through organic advocacy rather than paid campaigns or incentivized referrals. CLG is the holy grail metric for crypto founders because it indicates product-market fit strong enough to create self-sustaining expansion loops.
Measuring CLG requires isolating organic growth from paid or incentivized growth, then quantifying the economic value of that organic cohort. Here's how leading protocols operationalize this measurement:
Step 1: Attribution Source Tagging
Every new wallet interaction must be tagged with an acquisition source: organic social, paid ads, influencer referral, existing user invite, direct navigation, or unknown. This tagging happens at the smart contract level by requiring users to submit a referral code or source identifier with their first transaction.
For protocols where friction-free onboarding is critical, source attribution can be probabilistic - if a wallet's first transaction occurs within 2 hours of clicking a tracked link, that wallet gets attributed to the link source even without explicit code submission.
Step 2: Cohort Economic Value Calculation
Once wallets are source-attributed, calculate the lifetime value (LTV) of each acquisition cohort. LTV for DeFi protocols typically measures total fees paid over the user's active lifetime. For DePIN projects, LTV might measure compute resources purchased or data contributed.
The CLG multiplier emerges from comparing organic cohort LTV to paid cohort LTV:
CLG Multiplier = (Organic Cohort LTV) / (Paid Cohort LTV)
Protocols with strong product-market fit show CLG multipliers between 1.8-3.2x, meaning organic users generate nearly double to triple the lifetime value of users acquired through paid channels. Multipliers below 1.0 indicate that paid acquisition is outperforming organic growth, which suggests fundamental product or positioning problems.
Step 3: Advocacy Activation Rate
Not all community members become advocates. The advocacy activation rate measures what percentage of active users successfully refer at least one new user who completes a meaningful action (defined protocol-specifically - it might be depositing $100+ in a DeFi protocol or completing 5+ compute jobs in a DePIN network).
Healthy protocols achieve advocacy activation rates between 8-15%. Rates below 4% indicate weak product-market fit or insufficient social sharing mechanisms built into the product experience.
The DePIN-Specific CLG Framework
DePIN protocols face unique measurement challenges because their community includes both supply-side participants (node operators, hardware providers) and demand-side users (those consuming compute, storage, or connectivity). Traditional CLG frameworks collapse when these two cohorts require different acquisition strategies and deliver different economic values.
For DePIN-specific CLG measurement:
Supply-Side Metric: Calculate the percentage of new node operators referred by existing operators versus those acquired through paid campaigns. High-performing DePIN networks achieve 40-60% operator-referred expansion because existing operators have financial incentive to grow network capacity and improve service quality.
Demand-Side Metric: Track what percentage of enterprise or developer customers came through existing customer referrals versus outbound sales. Demand-side CLG typically matures later in protocol lifecycle - after the first 50-100 enterprise customers prove product utility.
Stablecoins powered $46 trillion in annual transaction volume ($9 trillion adjusted) in 2025, and the protocols that captured disproportionate share implemented sophisticated CLG measurement systems that optimized resource allocation toward the channels generating the highest-quality users.
Filtering Airdrop Hunters vs. Real Users
The single biggest metric distortion in Web3 comes from sybil attacks and airdrop farming - coordinated efforts where individual actors control dozens to thousands of wallets to maximize token distribution rewards. Research suggests that 40-60% of "community members" in early-stage protocols are mercenaries who will never become long-term users.

Implementing a multi-stage filtration process allows founders to identify real advocates by linking off-chain social activity with on-chain wallet behavior.
Filtering these users requires multi-layered defense systems that make farming economically unviable:
Layer 1: Sybil Resistance Scoring
Tools like Gitcoin Passport assign trust scores to wallet addresses based on verified identity components: Twitter account age, GitHub contribution history, proof-of-humanity verification, and historical on-chain behavior. Wallets with Passport scores above 25 (on a 100-point scale) represent genuine individuals; wallets below 10 are likely automated or disposable.
Implementing Passport-gated access to community benefits - early access, governance weight, reward eligibility - immediately filters low-conviction users without creating friction for legitimate participants.
Layer 2: Cross-Platform Identity Linking
Airdrop farmers maintain separate personas across platforms to avoid detection. Cross-platform identity linking breaks this strategy by requiring users to connect multiple verified accounts (Discord, Twitter, Telegram) to a single wallet address.
The filtering happens in analysis, not at the access gate. A wallet connected to a Discord account created 6 months ago with 4 total messages, a Twitter account with 12 followers and no original content, and a Telegram account that only speaks in emoji likely represents a farmer. A wallet connected to accounts with 2+ years of history, authentic engagement patterns, and social graphs that interconnect with other verified users likely represents a real person.
Layer 3: Post-Incentive Retention Measurement
The definitive filter for identifying mercenary users is measuring retention after incentives end. If a cohort of users acquired through a quest campaign shows 3% retention 60 days post-campaign while organic users retain at 24%, that cohort was predominantly mercenary regardless of how legitimate their behavior appeared during the campaign.
This metric becomes actionable when used to score acquisition channels. If a Twitter influencer partnership delivered 2,000 wallets with 2% post-incentive retention, that partnership should be de-prioritized in future campaigns even if initial "engagement" looked strong.
The Quality-Adjusted Community Value (QACV) Formula
Synthesizing these filters into a single metric creates the Quality-Adjusted Community Value calculation:
QACV = (Total Active Wallets) × (Average Sybil Resistance Score / 100) × (90-Day Retention Rate) × (Median LTV)
This formula adjusts raw wallet counts for quality, retention, and economic contribution. A protocol with 10,000 wallets, average sybil score of 40, 18% retention, and $85 median LTV calculates:
QACV = 10,000 × 0.40 × 0.18 × $85 = $61,200
That $61,200 represents the annualized economic value of the community after discounting for bots, farmers, and low-commitment users. Tracking QACV growth over time reveals whether expansion is building durable value or accumulating dead weight.
Protocols implementing these filtration systems often work with agencies specializing in web3 Discord community management to operationalize scoring infrastructure and integrate sybil detection with community platform tools.
What Does OG Stand for in Web3 Community Crypto?
OG stands for "Original Gangster" in Web3 community contexts, but the term has evolved to specifically designate early adopters who participated in a protocol before it achieved mainstream recognition or significant token value appreciation. OG status confers social capital and often comes with material benefits: early governance weight, exclusive NFTs, or preferential token allocations.
Identifying and measuring your OG cohort matters because these users demonstrate the strongest conviction and typically become the most valuable long-term advocates. Research across multiple protocol launches shows that OG cohorts - defined as users who joined pre-mainnet or during the first 90 days post-launch - generate 4-7x higher lifetime value than users acquired during later growth phases.
Quantifying OG Contribution
Measuring OG cohort value requires tracking these users as a distinct segment:
OG Cohort Definition: All wallets that executed their first protocol transaction before [specific date milestone - typically mainnet launch, first major exchange listing, or crossing 10,000 total users].
OG Engagement Premium: Compare the median transaction frequency, governance participation rate, and total fees paid by OG wallets versus wallets acquired in subsequent cohorts. Leading protocols see OG cohorts transact 3-5x more frequently and participate in governance at 4-8x higher rates.
OG Advocacy Multiplier: Calculate what percentage of new users in months 6-12 were referred by OG cohort members. Healthy protocols attribute 20-35% of mid-term growth to OG advocacy, even when OGs represent only 5-10% of total users.
The strategic implication is clear: disproportionate resources should flow toward retaining and activating OG users. A 10% churn reduction in the OG cohort generates more long-term value than a 30% expansion in late-stage user acquisition because OG users compound value through advocacy, governance leadership, and sustained economic participation.
Some protocols formalize OG recognition through tiered NFT systems where early participation earns permanent status markers. These NFTs serve dual purposes: they reward early commitment and create measurement infrastructure that makes OG cohort tracking automatic and transparent.
The Founder's Dashboard: 5 Metrics VCs Actually Care About
Venture capitalists evaluating Series A and Series B opportunities have seen every vanity metric manipulation in the playbook. By 2025, institutional investors converged on five core metrics that predict protocol durability and determine valuation multiples.
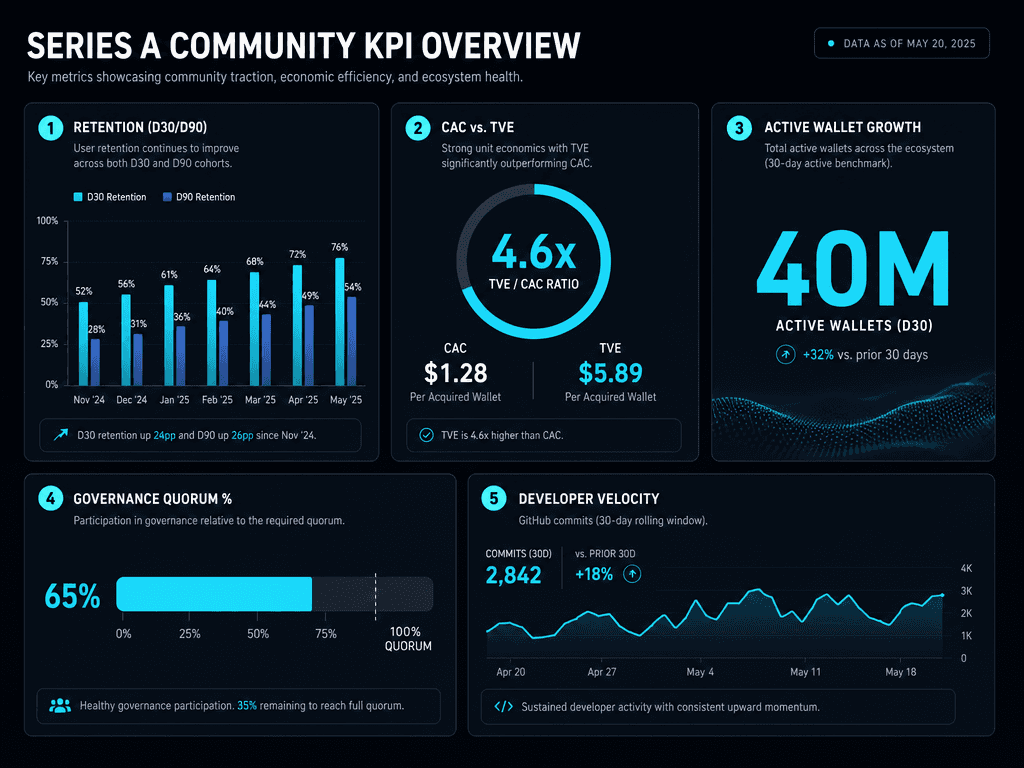
Venture capitalists prioritize metrics that prove economic utility and developer commitment over surface-level engagement data during Series A and B rounds.
1. LTV/CAC Ratio (Wallet-Level)
Customer Lifetime Value divided by Customer Acquisition Cost measures unit economics at the wallet level. For DeFi protocols, LTV equals total fees paid over the wallet's active lifetime. CAC includes all marketing spend, incentives, and liquidity mining rewards required to acquire and activate that wallet.
VCs expect LTV/CAC ratios above 3.0 for protocols past the 12-month mark. Ratios between 1.5-3.0 indicate the protocol is viable but not yet capital efficient. Ratios below 1.5 trigger serious questions about whether growth is sustainable without continuous token emissions or external funding.
The metric's power lies in forcing founders to account for the true cost of user acquisition. A protocol spending $45,000/month on crypto paid advertising and incentive programs must demonstrate that the lifetime value of acquired users exceeds that cost by at least 3x to prove economic sustainability.
2. 90-Day Active Wallet Retention
What percentage of wallets active in Month 1 remain active in Month 4? This single metric predicts long-term protocol health better than any other because it measures whether users find ongoing utility beyond initial curiosity or incentive hunting.
Exchange-traded products hold over $175 billion in on-chain crypto holdings as of 2025, but the protocols capturing institutional allocation demonstrate 90-day retention rates between 22-34%. Protocols below 15% retention struggle to raise institutional capital because those retention curves forecast unsustainable churn and eventual collapse.
Retention measurement must happen at the cohort level - tracking all wallets acquired in a specific month and measuring what percentage remain active 90 days later. Aggregate active user counts mask cohort-level decay and create false momentum narratives.
3. Governance Quorum Percentage
What percentage of eligible token holders participate in governance votes? This metric reveals community conviction and distribution health simultaneously. High quorum percentages (15-25% for major proposals) indicate that token holders see long-term alignment between their interests and protocol success. Low quorum (below 5%) suggests token concentration among speculators who don't engage with protocol direction.
VCs scrutinize governance participation because it predicts community response during crisis moments. Protocols that achieve 20%+ quorum during routine proposals can mobilize their communities for emergency governance, security responses, or strategic pivots. Protocols with 2% baseline quorum face coordination failure risk when rapid community action becomes necessary.
4. Developer Integration Velocity
How many third-party projects, protocols, or applications integrated your infrastructure in the past 90 days? For infrastructure protocols (oracles, data availability, bridges), this metric measures ecosystem leverage - each integration multiplies your potential user base and economic value.
The developer integration metric correlates strongly with long-term market cap because it measures switching costs. A protocol with 200+ dependent integrations becomes infrastructure that's expensive to replace, creating sustainable competitive moat. A protocol with 8 integrations remains vulnerable to displacement by technically superior alternatives.
5. Median Transaction Value (MTV)
What's the median dollar value of transactions processed by your protocol? This metric separates real economic activity from airdrop farming and bot testing. A DeFi lending protocol with median transaction values of $850 demonstrates users solving real financial problems. A protocol with median transaction values of $3 suggests most activity is low-conviction or automated.
MTV trends tell the quality story: if median transaction value increases over time while DAA remains stable, existing users are trusting the protocol with larger capital amounts - a leading indicator of market share expansion. If MTV declines while DAA grows, expansion is happening at the low end of the market through user acquisition strategies that attract smaller participants.
These five metrics form the minimum reporting dashboard for any founder pursuing institutional capital. The data stack required to calculate these metrics often requires specialized infrastructure and attribution systems, which is why many protocols partner with crypto marketing strategy teams to build measurement capabilities before entering fundraising conversations.
Tools for On-Chain Community Attribution
Measuring Web3 community engagement requires tools that bridge the gap between off-chain social behavior (Discord messages, Twitter engagement) and on-chain economic actions (transactions, staking, governance voting). The attribution challenge - linking a Discord username to a wallet address to a transaction history - determines whether community metrics generate actionable insight or remain disconnected vanity numbers.
Dune Analytics: Custom Dashboard Creation
Dune enables SQL-based querying of blockchain data, allowing founders to build custom dashboards tracking wallet-level cohort behavior. The platform's strength lies in flexibility: any on-chain metric can be calculated, visualized, and monitored in real-time.
Key use cases for community measurement:
Building retention cohort tables that track first-transaction date and subsequent monthly activity
Calculating token holder distribution and concentration metrics (Gini coefficients, top holder percentages)
Measuring governance participation rates and proposal-level engagement trends
Tracking transaction value distributions to identify whale versus retail user patterns
Dune's limitation is that it measures only on-chain activity - connecting that activity to off-chain identities requires additional tooling.
Formo: Off-Chain to On-Chain Attribution
Formo specializes in connecting social platform engagement to wallet addresses, solving the identity linking problem that prevents most protocols from calculating accurate attribution metrics. The platform's SDK integrates with Discord, Telegram, and Twitter to capture user interactions, then maps those users to wallet addresses through opt-in verification flows.
This infrastructure enables measuring:
Which Discord channels drive the highest quality wallet activations (measured by subsequent transaction value or retention)
Which Twitter campaigns generate wallets that participate in governance versus wallets that claim airdrops and exit
ROI calculations for crypto influencer marketing campaigns based on on-chain behavior of referred users
The platform's value increases exponentially for protocols running multi-channel campaigns where understanding which touchpoints drive economic actions (not just awareness) determines budget allocation.
Zealy and Galxe: Quest-Based Attribution
Quest platforms create trackable user journeys where community members complete specific actions (follow social accounts, write content, refer friends, execute on-chain transactions) to earn points or credentials. The quest structure creates built-in attribution because each action is logged and associated with a user profile.
Both platforms integrate with wallet verification systems, allowing founders to track:
What percentage of quest participants remain active 30, 60, and 90 days after quest completion
Which quest types (content creation, referral, on-chain action) generate the highest long-term retention
Cost-per-activated-wallet for quest campaigns versus traditional paid acquisition
The strategic value is in turning every community interaction into a measurable conversion event. A Discord conversation that includes a Zealy quest link becomes quantifiable: you can measure exactly how many users completed the quest, how many connected wallets, and how many of those wallets executed meaningful transactions.
Guild and Collab.Land: Token-Gated Community Metrics
Token-gating platforms restrict community access based on wallet holdings, creating automatic filtering of high-conviction users. Guild and Collab.Land integrate with Discord and Telegram to create tiered access systems where different holding thresholds unlock different community privileges.
The measurement value comes from role-based segmentation. Founders can compare:
Engagement rates in token-gated channels versus public channels
Content quality and discussion depth across holding tiers
Governance proposal origination and participation rates by wallet size category
This segmentation reveals whether whales or retail holders drive community activity and whether token distribution correlates with engagement quality.
The Attribution Stack in Practice
Leading protocols combine these tools into integrated measurement systems:
Acquisition: Track initial user touchpoint through referral codes or campaign-specific landing pages
Engagement: Monitor off-chain social activity through Formo or native platform analytics
Activation: Measure wallet connection and first transaction through Dune dashboards
Retention: Build cohort tables showing monthly activity persistence
Revenue: Calculate lifetime value through total fees paid or economic actions completed
Referral: Track advocacy through quest platform referral systems or Guild-based community growth
Each tool measures one segment of the user journey; the attribution stack connects those segments into a complete picture of community economic value. Implementing this infrastructure typically requires 6-12 weeks of technical integration and costs $3,000-$8,000 monthly in tool subscriptions and data engineering resources.
There are an estimated 40-70 million active crypto users globally as of late 2025, but protocols capturing disproportionate market share are those that built sophisticated attribution infrastructure and used that infrastructure to optimize every dollar of community investment.
h2, h3
