65
Published
July 2026
Updated
The Web3 Marketing ROI Framework for Crypto Founders: Moving Beyond Vanity Metrics

Tyler Mullins
Founder & Owner of OMNI
Introduction
Most crypto founders spend six figures on marketing only to discover their agency can't tell them which campaign drove actual wallet activations versus bot traffic. The Discord server swells to 50,000 members. Twitter engagement hits all-time highs. Yet protocol revenue stalls at $200k ARR, and the Series A deck falls flat because no one can prove marketing ROI beyond "brand awareness."
This isn't a creative problem. It's an attribution problem. Web3 marketing lives in a dark funnel where off-chain engagement disappears before it hits on-chain revenue. Founders track impressions while investors demand activated wallets, retention-adjusted CAC, and LTV multiples above 3:1. That gap - between what agencies report and what boards actually need - costs protocols their next funding round.
What follows is the complete Web3 marketing ROI framework used by growth-stage protocols to map every dollar spent to wallets activated, transactions completed, and revenue generated. This is the system that turns marketing from a budget line into a capital-efficient growth engine.
Key Takeaways
Wallet-bearing visitors convert at 7x the rate of generic website traffic, making Cost Per Wallet (CPW) the primary acquisition metric that replaces traditional CAC in Web3 marketing ROI frameworks.
The activation gap - where 65% of visitors connect wallets but only 35% complete a first transaction - represents the largest source of wasted marketing spend in crypto, costing protocols an average of $1.86 per non-transacting user.
UTM-to-wallet mapping solves the attribution black hole by bridging off-chain marketing touchpoints to on-chain revenue events, enabling true ROI calculation across influencer campaigns, paid media, and community channels.
Pre-TGE marketing budgets range from $20,000 to $100,000+ monthly, with growth-stage protocols allocating 9.4% of revenue to maintain the 3:1 LTV/CAC ratio required for institutional funding rounds.
Vertical-specific ROI models reveal that DeFi TVL contribution differs fundamentally from DePIN hardware activation economics and gaming ARPU calculations - requiring protocol-specific measurement frameworks rather than generic Web2 metrics.
Table of Contents
The Death of the Web2 Pixel: Why Traditional Analytics Fail in Web3
The Tier-1 Web3 KPIs Crypto Founders Must Track
Vertical-Specific ROI Models for DeFi, DePIN, and Gaming
How Much Should a Crypto Startup Spend on Marketing?
The Technical Reality of UTM-to-Wallet Attribution
Measuring Crypto Influencer ROI With On-Chain Data
The Web3 Analytics Stack That Replaces Google Analytics
How Token Vesting Schedules Impact LTV Calculations
Frequently Asked Questions
The Death of the Web2 Pixel: Why Traditional Analytics Fail in Web3
Traditional marketing attribution relies on the Facebook Pixel or Google Analytics tracking a user from ad click through checkout. That model breaks completely in Web3 because the conversion event - a wallet transaction - happens outside your website on a blockchain that your tracking script can't see.
The average crypto founder inherits a Web2 playbook from their agency: UTM parameters, conversion tracking, remarketing pixels. They spend $50,000 on a Twitter campaign, see 200,000 impressions and 12,000 site visits in Google Analytics, then check their protocol dashboard to find only 147 new wallets connected and 52 first transactions. The gap between 12,000 visits and 52 transactions represents the attribution black hole - marketing spend that generated awareness but can't be traced to revenue.
This measurement failure has real consequences. When a DeFi protocol can't prove which marketing channel drove their highest-LTV users, they default to spending more on the channel with the most "engagement" - which often means paying influencers for bot-driven likes instead of funding the Discord community manager who converted 40 lurkers into $250k TVL contributors. A 2024 Chainalysis study found that 72% of Web3 brands now monitor LTV/CAC ratios specifically to avoid this trap, but most still can't calculate those ratios accurately because they lack the technical infrastructure to map off-chain marketing touches to on-chain wallet behavior.
The solution isn't better Web2 analytics. It's UTM-to-wallet mapping - a system that captures a user's initial marketing source (Twitter ad, KOL post, Discord invite) and carries that attribution data through to their wallet address when they connect and transact. OMNI Agency implemented this for a DeFi lending protocol in Q4 2025, replacing their generic Google Analytics setup with Formo's attribution bridge and custom Dune dashboards. Within six weeks, the founder could show their board exactly which of their three top influencers drove wallets that deposited an average of $8,400 versus $1,200, shifting their entire influencer budget toward the high-LTV creator and cutting their blended CAC by 34%.
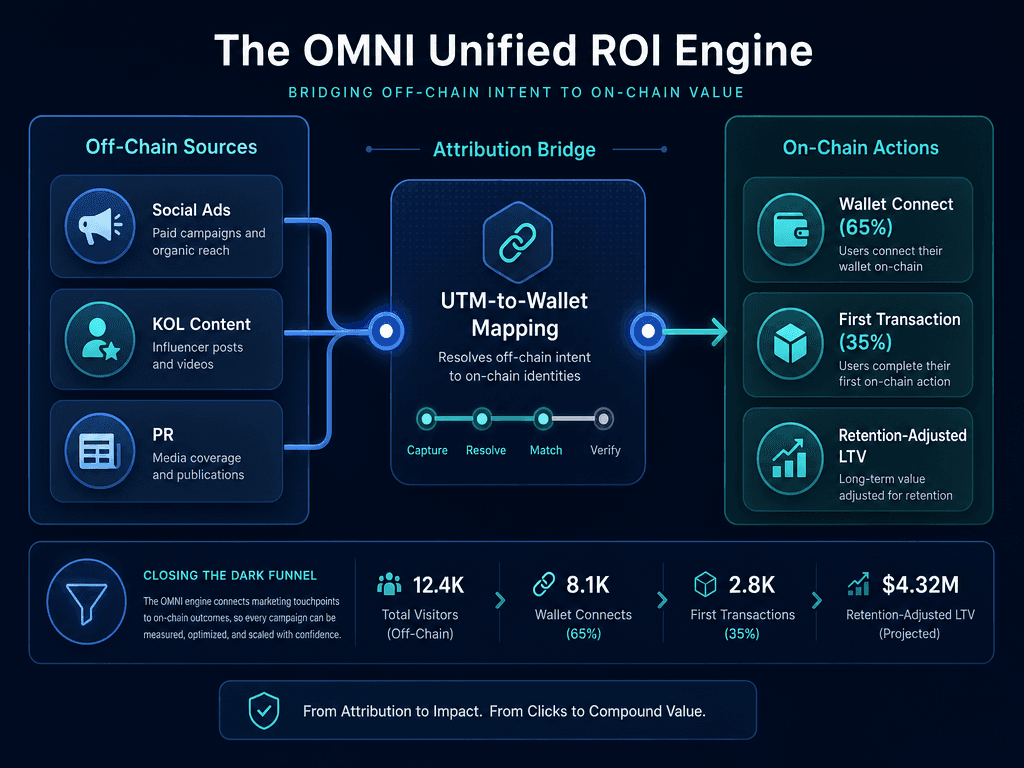
OMNI's attribution bridge solves the 'dark funnel' problem by linking initial social engagement directly to on-chain revenue events, providing a clear path to ROI.
The technical implementation requires three components: a tracking parameter appended to every marketing link (Twitter bio, influencer post, paid ad), a middleware layer that captures that parameter when a user lands on your site, and a wallet-connection event that writes the marketing source into a database keyed to the connected wallet address. From there, every on-chain action by that wallet - first transaction, TVL deposit, NFT mint, token swap - can be traced back to the original marketing source. This is how growth-stage protocols prove ROI to investors and make data-driven decisions about where to deploy the next $100k of marketing budget.
The Tier-1 Web3 KPIs Crypto Founders Must Track
Cost Per Wallet (CPW) replaces traditional Cost Per Acquisition as the primary metric for Web3 marketing ROI because a connected wallet represents verified crypto-native intent. Research from Addressable and Coinbound shows that wallet-bearing visitors convert at roughly 7x the rate of generic website traffic, making CPW the most predictive indicator of marketing efficiency.
CPW benchmarks vary dramatically by vertical and user type. A 2025 Coinbound analysis of 40+ crypto campaigns found that stablecoin projects achieve an average CPW of $1.86, while trader acquisition for derivatives platforms ranges between $14 and $31. Referral-channel CAC in Web3 averages $150 - significantly higher than paid ads but with substantially stronger retention rates that justify the premium. These numbers provide founders with realistic targets: if your paid media campaign is generating wallets at $45 CPW for a non-trading DeFi product, you're overpaying by 2-3x industry benchmarks.
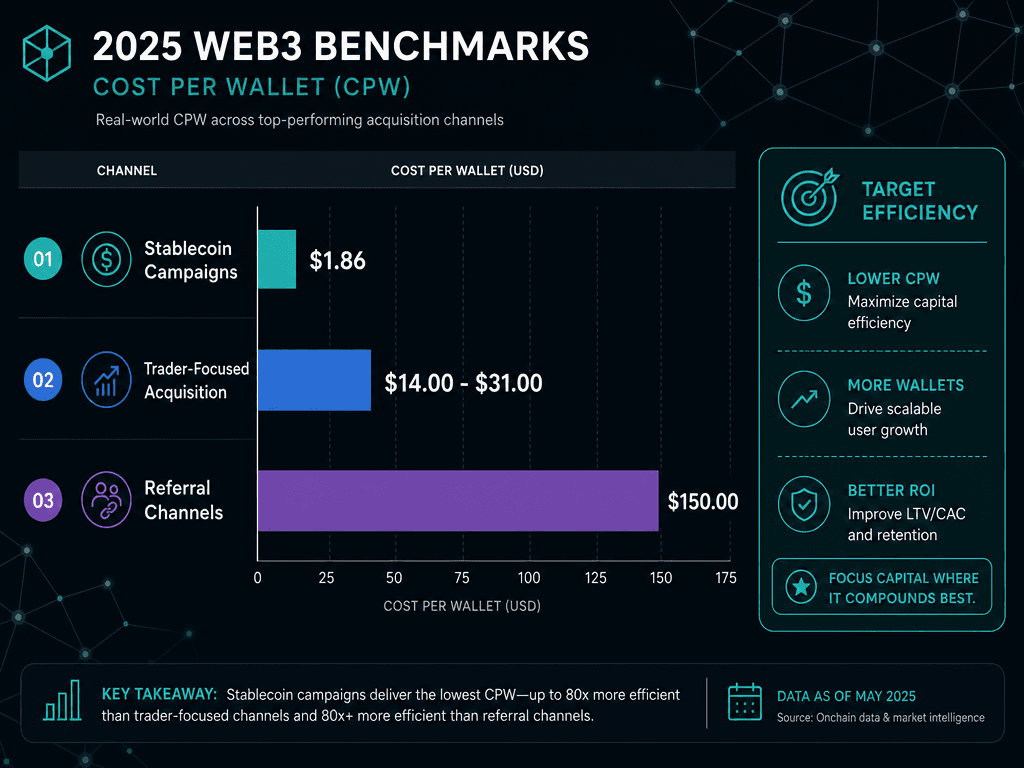
Understanding CPW benchmarks allows founders to set realistic growth targets and identify which acquisition channels offer the highest capital efficiency for their protocol.
The Activation Rate Gap
Approximately 65% of dApp visitors connect their wallets, but only 35% complete a first transaction according to 2026 data from Formo. This 30-percentage-point gap is where most marketing budgets die. A protocol spending $50,000 to drive 2,000 wallet connections at $25 CPW celebrates the vanity metric without realizing that 1,300 of those wallets will never transact - meaning the real cost per activated user is $71, not $25.
User disengagement in Web3 typically hits 63% within the first seven days without frictionless onboarding, per Messari's 2025 retention study. The activation rate - the percentage of connected wallets that complete at least one meaningful transaction within 7 days - determines whether your marketing spend is building a protocol or just inflating your wallet-connection dashboard.
The highest-performing protocols obsessively measure and optimize this gap. When a DePIN project we worked with analyzed their activation funnel, they discovered that users coming from their technical documentation had an 81% activation rate, while users from broad-reach Twitter ads had only 22% activation. They shifted budget from Twitter impressions to SEO content targeting "how to set up DePIN node" searches, cutting their fully-loaded CAC from $140 to $67 while 2x-ing monthly active hardware units.
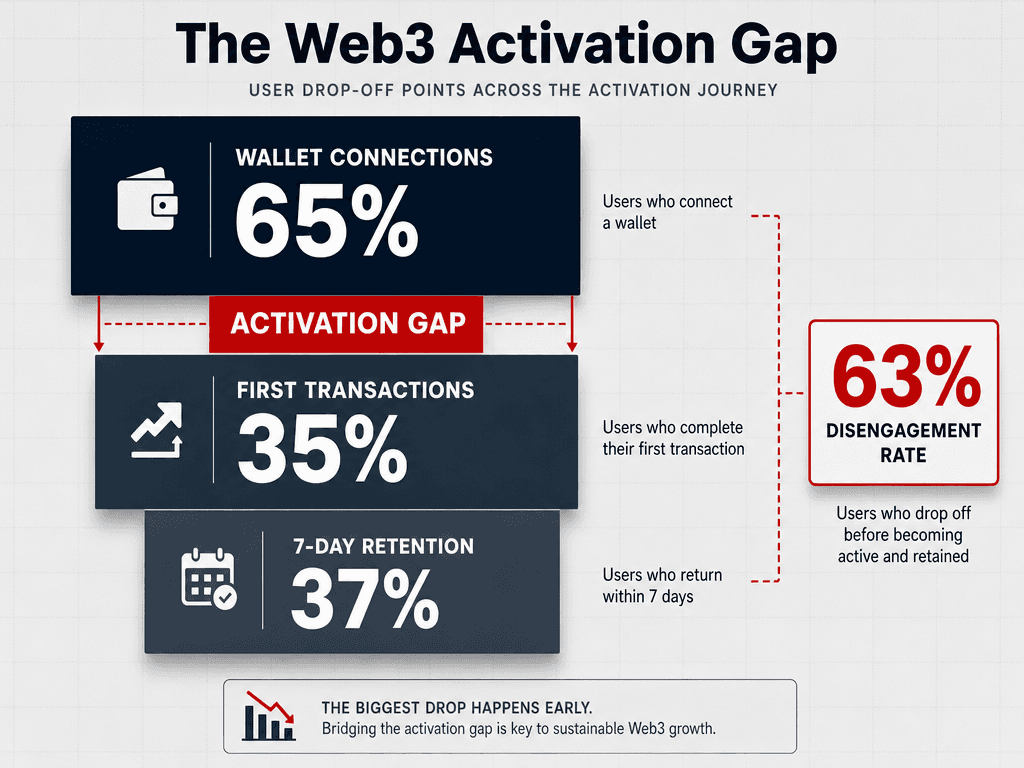
Identifying the gap between connection and transaction is critical for optimizing the onboarding flow and reducing marketing spend waste on non-transacting users.
Retention-Adjusted CAC: Why a $50 Whale Beats a $1 Airdrop Farmer
Traditional CAC treats all acquired users equally. Web3 economics demand retention-adjusted CAC - the acquisition cost divided by the user's probability of remaining active beyond 90 days. An airdrop farmer acquired for $1 who churns after claiming tokens has an infinite retention-adjusted CAC. A power user acquired for $50 who remains active for 18+ months has a retention-adjusted CAC under $3 when amortized across their lifetime.
The math changes everything about channel allocation. Broad-reach campaigns on TikTok or Reddit might generate 10,000 wallet connections at $2 CPW, but if 95% of those wallets churn within 30 days, the retention-adjusted CAC for the 500 who stay is $40 - making your "cheap" channel more expensive than the $35 CPW you're paying for highly-targeted users from crypto-native newsletters who have 85% 90-day retention.
This is where crypto community management becomes a measurable ROI driver rather than a brand-building expense. A dedicated Discord community manager costs $6,000-$8,000 monthly but can increase 90-day retention from 35% to 58% by onboarding new members, answering technical questions within 4 hours, and creating retention loops through roles and contribution rewards. When that retention lift applies to 400 new users per month acquired at $30 CAC, the community manager's salary pays for itself by preventing $82,800 in wasted acquisition spend annually.
Vertical-Specific ROI Models for DeFi, DePIN, and Gaming
Generic Web3 KPIs fail because DeFi TVL contribution, DePIN hardware activation economics, and gaming ARPU operate on fundamentally different unit economics. A retention-adjusted CAC of $85 bankrupts a casual gaming protocol but represents exceptional efficiency for an institutional DeFi platform where average user LTV exceeds $12,000.
DeFi: TVL Contribution vs. Yield-Farming Churn
DeFi protocols must distinguish between sticky liquidity and mercenary capital. The primary DeFi ROI metric is TVL Contribution per Marketing Dollar - calculated as (New TVL Deposited in First 90 Days) / (Marketing Spend to Acquire Those Users). A well-optimized campaign generates $12-$18 in 90-day TVL per dollar of marketing spend.
The hidden complexity is separating yield farmers from committed liquidity providers. A 2025 analysis of Arbitrum-based lending protocols found that users acquired through yield-farming incentive campaigns had 14-day TVL retention of only 23%, while users acquired through educational content and governance participation had 14-day retention of 76%. The latter group cost 3.4x more to acquire but delivered 6.1x higher LTV, making their fully-loaded ROI 1.8x better despite the higher upfront CAC.
Track cohort-based TVL retention at 7, 30, 90, and 180 days. Users who remain past 90 days typically stay for 12+ months, making the 90-day mark your breakeven threshold. If your blended CAC is $120 and your 90-day retained users contribute an average of $8,400 TVL generating 4.2% protocol revenue annually, each retained user generates $352/year in protocol revenue - a 2.9x first-year return before calculating Years 2-3.
DePIN: Hardware Activation ROI
DePIN projects track ROI through Hardware Unit Economics: (Lifetime Network Revenue per Active Node) / (Fully-Loaded Cost to Activate Node). "Activation" means a purchased node that completes setup and remains online for 30+ consecutive days, contributing verifiable work to the network.
The marketing challenge is that node purchase doesn't equal node activation. A Helium-style network might sell 1,000 hotspots but see only 620 complete setup and only 340 remain active past 90 days. If marketing spend per node sold is $80, the real cost per 90-day active node is $235 - and that's the number that determines marketing ROI, not the vanity metric of units sold.
OMNI's work with DePIN infrastructure projects has shown that technical onboarding content - video setup guides, Discord troubleshooting channels, regional Telegram groups for hardware configuration - cuts the activation gap from 62% to 83%, effectively reducing fully-loaded CAC by 34% without spending another dollar on paid acquisition. When your LTV per active node is $4,200 over three years and your retention-adjusted CAC drops from $235 to $155, you've created $80 in additional profit per unit that scales across every node activated. For a network targeting 10,000 active nodes, that optimization is worth $800,000 in additional protocol value.
Gaming: ARPU vs. Token Velocity
Web3 gaming splits into two economic models: free-to-play with in-game purchases (ARPU-driven) and play-to-earn with token rewards (velocity-driven). Marketing ROI frameworks differ completely between them.
ARPU-driven games measure Average Revenue Per User over 90, 180, and 365-day windows, targeting LTV/CAC ratios above 4:1 at the 180-day mark. A successful Web3 game with $8 monthly ARPU and 60% 6-month retention has a $28.80 180-day LTV per user, justifying a CAC up to $7.20 to maintain a 4:1 ratio. Marketing channels must be evaluated based on both acquisition cost and the quality of users they deliver - measured by day-7, day-30, and day-90 retention plus average session length and purchase propensity.
Play-to-earn economics are inverted: the protocol pays users to play, earning revenue from token sales, marketplace fees, and NFT primary sales. The key metric is Token Sink Efficiency: (Total Token Value Removed from Circulation via Burns, Fees, NFT Mints) / (Total Token Value Distributed as Rewards). Marketing ROI is positive when newly acquired users generate more token sinks than the rewards they extract.
A 2025 Axie Infinity case study showed that users acquired through competitive esports content and leaderboard campaigns had 2.8x higher token sink ratios than users acquired through generic "earn while you play" ads - because competitive players spent tokens on NFT upgrades and marketplace trades to improve performance, while passive earners simply extracted rewards and sold. The competitive segment cost $42 CAC vs. $18 for passive earners, but their 90-day contribution to protocol revenue was $180 vs. -$24 (net negative), making the expensive segment infinitely more valuable.
For more on tailoring Web3 marketing to specific verticals, see our DeFi marketing strategy guide which covers TVL optimization in depth.
How Much Should a Crypto Startup Spend on Marketing?
Pre-TGE marketing budgets typically range from $20,000 to $100,000+ per month according to 2026 data from AP Collective, with allocation heavily weighted toward community building, influencer seeding, and content creation that positions the protocol for launch. Growth-stage startups post-launch allocate roughly 9.4% of company revenue to marketing based on GTM8020's 2026 startup benchmark report, though crypto protocols often run higher - 12-18% of revenue - during high-growth phases when acquiring market share justifies premium CAC spending.
The critical constraint is maintaining a 3:1 LTV/CAC ratio, which has become the institutional funding standard. Protocols that slip below 2.5:1 face difficult questions in Series A and B rounds about unit economics sustainability. This ratio determines your maximum allowable CAC: if your 12-month LTV is $360, you can't exceed $120 CAC and maintain a healthy 3:1 multiple.
Stage | Monthly Budget Range | Primary Focus | Target LTV/CAC |
|---|---|---|---|
Pre-Seed / Building | $5,000 - $20,000 | Community seeding, early content, Discord setup | N/A (pre-revenue) |
Pre-TGE / Launch Prep | $20,000 - $100,000 | Influencer campaigns, PR, waitlist growth | 3:1 minimum |
Post-Launch Growth | 9.4% - 18% of revenue | Paid acquisition, retention optimization, partnerships | 3:1 - 4:1 target |
Series A+ Scale | 12% - 20% of revenue | Multi-channel paid media, international expansion | 3.5:1+ to maintain margins |
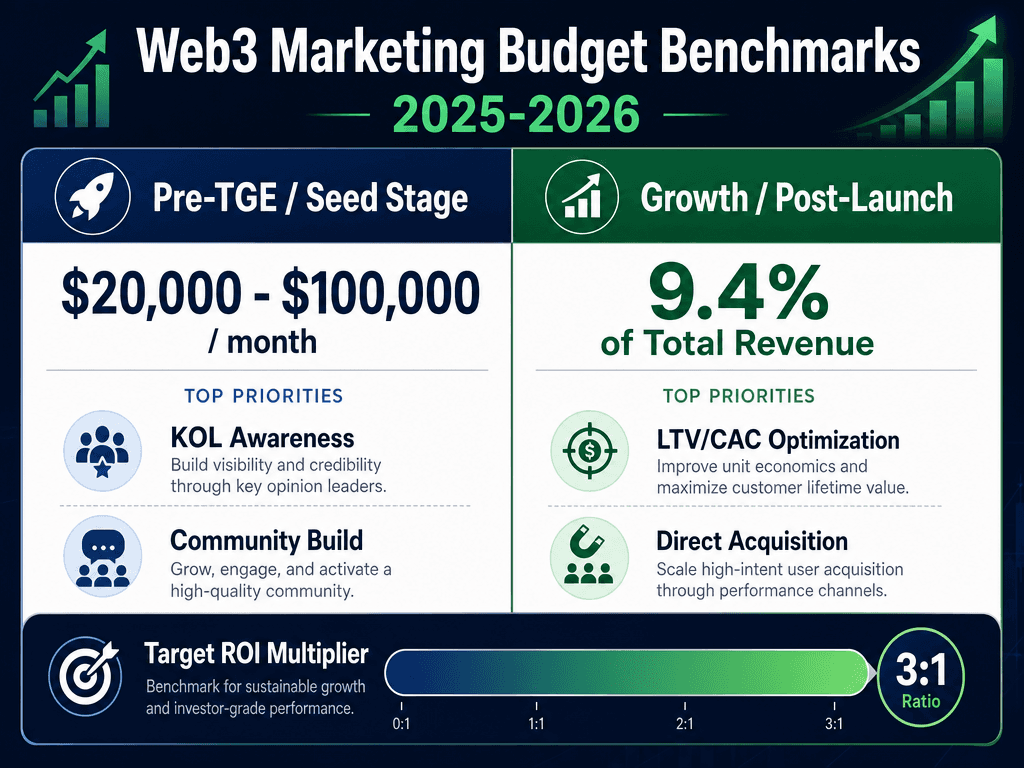
Aligning your marketing budget with project maturity ensures sustainable growth while maintaining the 3:1 LTV/CAC ratio required to secure follow-on funding from top-tier VCs.
Budget allocation within these ranges should follow performance data, not even distribution. The default trap is spreading budget across "all the channels" - $10k to Twitter ads, $10k to influencers, $10k to Discord bots, $10k to PR - without measuring which channel drives activated wallets at profitable CAC. After 60 days of baseline data across channels, reallocate aggressively toward your top two performers. If Twitter ads deliver $31 CPW and influencer campaigns deliver $48 CPW but influencer users have 2.6x higher 90-day retention, the fully-loaded CAC math may favor doubling down on influencers despite the higher upfront cost.
OMNI typically recommends a 70/20/10 budget split: 70% to proven channels with positive ROI data, 20% to optimization and testing within those channels, and 10% to experimental new channels that might become your next core driver. This model prevents the "spray and pray" approach while maintaining room for discovery. When we applied this framework to a DeFi protocol spending $85,000 monthly across nine channels, consolidating 70% of spend into their top three channels (targeted crypto newsletters, technical content SEO, and on-chain referral rewards) increased monthly activated wallets from 840 to 1,340 - a 60% volume increase with the same total budget by eliminating spend on underperforming channels with CPW above $90.
The Technical Reality of UTM-to-Wallet Attribution
UTM-to-wallet mapping works by capturing standard UTM parameters (utm_source, utm_medium, utm_campaign) when a user clicks a tracked link, storing those parameters in browser local storage or session cookies, then writing them to a database when the user connects their wallet. The technical challenge is that wallet connection happens through a third-party provider (MetaMask, WalletConnect, Phantom) that doesn't natively pass marketing attribution data.
The implementation requires three technical components:
Component 1: Parameter Capture Middleware Every marketing link must append UTM parameters: yourprotocol.com?utm_source=twitter&utm_medium=kol&utm_campaign=launch_week. When a user lands on your site, your frontend captures these parameters via JavaScript and stores them in sessionStorage or localStorage, where they persist across page navigation and remain available when the user eventually connects their wallet.
Component 2: Wallet Connection Event Listener Your dApp's wallet connection function must include an event listener that fires when a user successfully connects. At that moment, retrieve the stored UTM parameters and make an API call to your backend that writes a database record mapping the wallet address to the marketing source: {wallet: "0x1a2b3c...", source: "twitter", medium: "kol", campaign: "launch_week", timestamp: "2026-01-15T14:22:31Z"}.
Component 3: On-Chain Transaction Attribution Once the mapping exists, every subsequent on-chain transaction by that wallet can be attributed back to the original source. This requires blockchain event monitoring - either through node infrastructure or a service like Alchemy or QuickNode - that watches for transactions from known wallet addresses and enriches them with attribution data from your database.
The result is a complete funnel: User clicks KOL's Twitter link → lands on site → browses documentation → connects wallet (attribution written to database) → completes first transaction (attributed to KOL campaign) → deposits $5,000 TVL (attributed to KOL campaign) → remains active for 90 days (retention attributed to KOL campaign). Now you can calculate that this specific KOL delivered 340 activated wallets at $38 CPW with $2.8M in 90-day TVL contribution, proving an ROI of 4.1x on their $13,000 campaign fee.
The technical lift is significant but not impossible. OMNI implements this for clients using Formo's attribution SDK, which handles the parameter capture, wallet mapping, and dashboard visualization out of the box. For protocols with in-house engineering resources, building a custom solution takes 3-4 weeks of dedicated backend and frontend work plus ongoing maintenance to handle edge cases (users who clear browser storage, multi-wallet users, VPN traffic).
The alternative - continuing to market without attribution - costs more than the implementation. When a protocol can't prove which of their five agency partners is delivering profitable ROI, they either continue funding all five (wasting 60%+ of budget on underperformers) or cut spending entirely during the next bear market (killing growth momentum). Attribution infrastructure turns marketing from a faith-based expense into a data-driven growth engine.
Measuring Crypto Influencer ROI With On-Chain Data
Influencer marketing represents 20-35% of total Web3 marketing budgets, yet most protocols can't measure influencer ROI beyond engagement metrics. A KOL posts about your protocol, generates 40,000 impressions and 1,200 likes, and the protocol has no idea whether those impressions drove five wallets or 500.
On-chain influencer attribution requires UTM-to-wallet mapping plus one additional layer: unique tracking links or promo codes per influencer. When KOL A shares yourprotocol.com?ref=cryptoKOLA and KOL B shares yourprotocol.com?ref=defiKOLB, every wallet activation and transaction can be traced to the specific creator.
The 2025 Coinbound influencer benchmark study found that referral-channel CAC in Web3 averages $150 - significantly higher than paid ads at $31 CPW - but with retention rates 2.8x stronger. The economics make sense: users who discover a protocol through a trusted creator they already follow have higher intent and stronger protocol fit than users who clicked a generic paid ad. They're more likely to complete onboarding, less likely to churn within 30 days, and more likely to become protocol advocates themselves.
OMNI's on-chain influencer measurement framework tracks six metrics per creator:
Activated Wallets: Connected wallets that completed at least one transaction within 7 days
Blended CPW: Total influencer fee divided by activated wallets
90-Day TVL/Volume Contribution: Total on-chain value attributed to wallets from this creator
Retention Rate: Percentage of activated wallets still active at 30, 60, and 90 days
Secondary Referrals: New wallets activated through the protocol's referral program by users originally sourced from this creator
Fully-Loaded ROI: (Total protocol revenue from attributed wallets) / (Influencer fee + internal coordination costs)
When we implemented this for a Solana DeFi protocol in Q4 2025, the founder discovered that their highest-paid influencer ($18,000 per campaign) was delivering 140 activated wallets at $128 CPW with 31% 90-day retention, while a mid-tier creator ($4,000 per campaign) was delivering 180 activated wallets at $22 CPW with 67% 90-day retention. The expensive creator had 10x the followers but attracted airdrop farmers. The mid-tier creator had a smaller, more engaged audience of actual DeFi users. The protocol shifted 70% of influencer budget to mid-tier creators with proven on-chain performance, cutting blended CAC from $94 to $41 while increasing monthly activated wallets from 620 to 1,100.
The challenge is that most Web3 influencers resist performance-based compensation because they're accustomed to flat fees for posts regardless of results. The market is shifting as protocols demand accountability. Forward-thinking creators now accept hybrid deals: a lower base fee plus performance bonuses tied to activated wallets or TVL contribution. A $6,000 base fee plus $15 per activated wallet aligns incentives - the creator earns more by driving real users, and the protocol pays more only when ROI is proven.
For protocols running multiple influencer campaigns simultaneously, our Web3 KOL partnership best practices guide provides a complete framework for creator selection, deal structuring, and performance measurement.
The Web3 Analytics Stack That Replaces Google Analytics
Google Analytics captures website behavior but stops at the wallet connection - leaving a blind spot where 70% of Web3 value creation happens. The modern Web3 analytics stack combines Web2 behavior tracking with on-chain transaction monitoring to build a complete user journey from first touch to lifetime value.
The Four-Layer Web3 Analytics Architecture:
Layer 1: Web Behavior Tracking (Google Analytics, Mixpanel, Plausible) Continue using Google Analytics or privacy-focused alternatives like Plausible to track website traffic, page views, session duration, and pre-wallet behavior. This layer answers: where traffic comes from, which content drives wallet connection attempts, what the drop-off rate is on the connection page.
Layer 2: Attribution Middleware (Formo, Spindl, Custom) Attribution platforms sit between your website and blockchain, capturing UTM parameters, managing wallet-to-source mapping, and writing attribution data to a database. Formo and Spindl are the two dominant platforms in 2026, both offering SDK integration, real-time dashboards, and cohort analysis. Formo excels at technical documentation and implementation support. Spindl offers stronger integrations with ad platforms for closed-loop campaign optimization.
Layer 3: On-Chain Analytics (Dune Analytics, Nansen, Flipside Crypto) On-chain analytics platforms query blockchain data directly, tracking wallet transactions, TVL deposits, token swaps, NFT mints, and smart contract interactions. Dune Analytics is the industry standard for custom SQL queries and shareable dashboards. Nansen adds wallet profiling (identifying whether a wallet is a whale, DeFi power user, NFT collector, etc.) to help segment users by on-chain behavior patterns. Flipside Crypto offers pre-built protocol-specific dashboards for 50+ major blockchains.
Layer 4: Business Intelligence Integration (Custom Data Warehouse) The final layer brings everything together: web behavior from Layer 1, attribution from Layer 2, and on-chain data from Layer 3, all feeding into a unified data warehouse (Snowflake, BigQuery, Postgres) that powers executive dashboards showing cohort-based LTV, retention curves, channel-specific ROI, and fully-loaded CAC by acquisition source.
Platform | Core Strength | Best For | Pricing Model |
|---|---|---|---|
Formo | UTM-to-wallet mapping, technical implementation | Protocols needing attribution infrastructure | Custom (starts ~$2k/month) |
Spindl | Ad platform integration, closed-loop optimization | Protocols running significant paid media | Performance-based pricing |
Dune Analytics | Custom SQL queries, shareable dashboards | Data teams building custom analytics | Free + Pro ($390/month) |
Nansen | Wallet profiling, whale tracking | Protocols targeting high-value users | Starts $150/month (individual) |
Flipside Crypto | Pre-built protocol dashboards, bounty programs | Protocols without data teams | Free + Enterprise (custom) |
OMNI's typical implementation for a growth-stage protocol uses Formo for attribution, Dune for on-chain dashboards, and a custom Metabase instance connected to a Postgres database for executive reporting. This stack costs $5,000-$8,000 monthly (mostly engineering time to maintain) and provides the founder with answers to every ROI question their board asks: Which marketing channel has the best LTV/CAC ratio? What's our 90-day retention by cohort? How much TVL came from influencer campaigns vs. paid ads vs. organic content?
The investment pays for itself the first time a founder makes a $50,000 budget reallocation decision based on data rather than intuition. Without attribution infrastructure, that decision is a coin flip. With proper analytics, it's mathematical certainty.
How Token Vesting Schedules Impact LTV Calculations
Token vesting schedules - the time-locked release of tokens to team members, early investors, and community participants - create a distortion in LTV calculations that most founders miss until it's too late. A user who receives $10,000 worth of vested tokens appears to have high LTV, but if 80% of that value unlocks in 18 months and the user plans to sell immediately, their real economic contribution to the protocol is a fraction of the nominal vesting value.
Vesting-adjusted LTV requires calculating the net present value of a user's token allocations, discounted by both the time to unlock and the probability that vested tokens will be sold rather than staked or held. The formula: Vesting-Adjusted LTV = (Immediate Revenue) + (NPV of Vested Tokens × Retention Probability × Hold Probability).
A concrete example: A DeFi protocol acquires a user at $85 CAC who immediately contributes $200 in protocol fees (swap fees, lending interest) and receives 1,000 protocol tokens worth $5,000 at current price, vesting linearly over 12 months. Naive LTV calculation: $200 + $5,000 = $5,200, creating an extraordinary 61:1 LTV/CAC ratio. Reality check: The user's real economic value is $200 in immediate fees plus the discounted future value of tokens they'll hold, not sell. If 70% of vested tokens are typically sold within 30 days of unlock (common for mercenary liquidity), and the protocol's 12-month token retention rate is 40%, the adjusted LTV is: $200 + ($5,000 × 0.40 × 0.30) = $200 + $600 = $800, creating a more realistic 9.4:1 ratio.
The implications are significant for protocols running token incentive campaigns to bootstrap liquidity. Unadjusted LTV makes mercenary capital look profitable, leading to over-spending on incentive programs that attract yield farmers who extract value and leave. A 2025 analysis by RZLT.io found that AI-driven LTV models incorporating vesting schedules and historical holder behavior achieve up to 89% prediction accuracy - far better than the 43% accuracy of naive models that treat all vested tokens as realized revenue.
Forward-thinking protocols now segment users by token behavior patterns:
Immediate Sellers (40-60% of recipients): Users who sell vested tokens within 7 days of unlock - treat their LTV as immediate revenue only
Strategic Reducers (25-35%): Users who sell 40-70% of vested tokens and hold the remainder - discount vested token value by 50%
Long-Term Holders (10-20%): Users who hold 80%+ of vested tokens beyond 90 days - count full vested value in LTV with time-discount factor
This segmentation allows precise CAC calculations by user type. If your protocol can identify which marketing channels attract long-term holders (typically: governance-focused content, technical documentation, builder communities) versus immediate sellers (typically: high-APY yield-farming promotions, airdrop hunter communities), you can shift budget toward channels that deliver users with higher vesting-adjusted LTV despite potentially higher upfront CAC.
OMNI implemented vesting-adjusted LTV tracking for a layer-2 protocol running a $400,000 liquidity mining campaign. Historical data showed that users acquired through broad Twitter ads had an 83% immediate-seller rate, while users acquired through developer documentation and GitHub had a 61% long-term holder rate. Reallocating 40% of incentive budget from Twitter to developer-focused campaigns reduced total wallet activations by 18% but increased vesting-adjusted LTV by 127%, making the program significantly more profitable despite lower vanity metrics.
For deeper analysis of retention and LTV optimization in Web3 contexts, see our comprehensive crypto exchange marketing guide which covers cohort retention modeling for trading platforms.
h2, h3